Creating a coredump
How to create coredumps?
Coredumps are snapshots of your device's memory at a particular point in time. They, along with the
firmware .elf enable us to reproduce and debug issues you may experience with variable resolution
during a debugging session.
When should I consider creating a coredump?
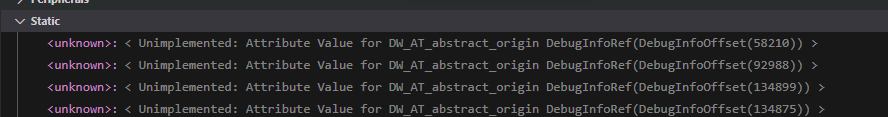
Every time you see something off in the variable list, e.g. where probe-rs prints an error instead of a value. The following image illustrates one such case:
How can I create a coredump?
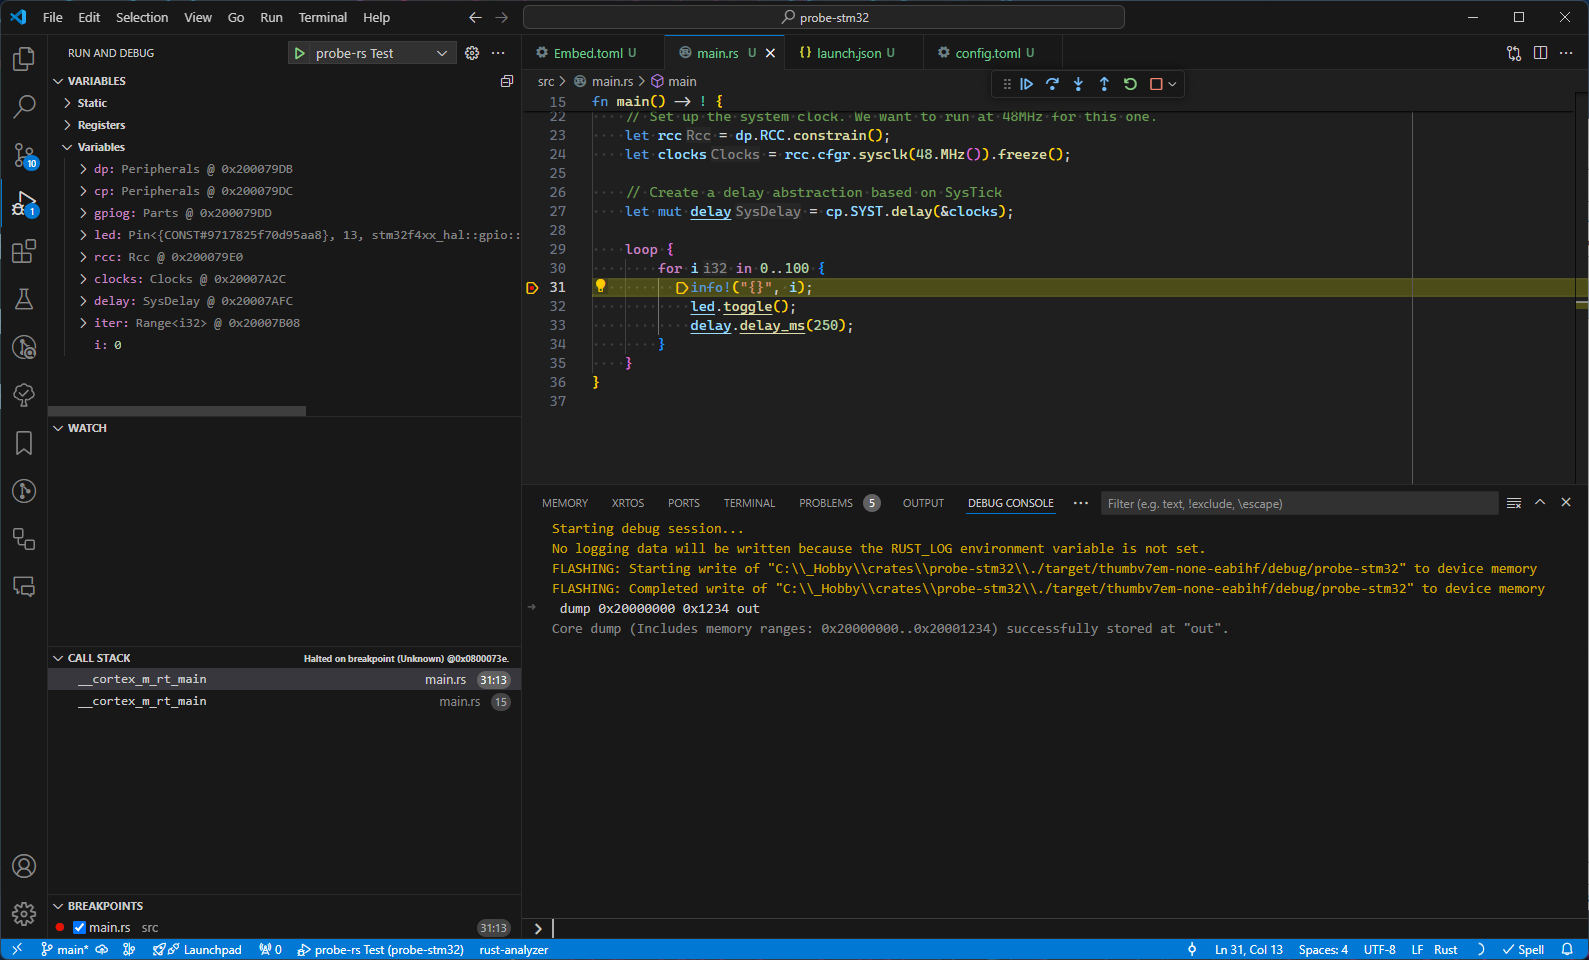
First up, stop your program at a point that illustrates your issue. Next, you should open the
DEBUG CONSOLE and type the following:
dump <start address> <memory length> <output file path>
For example, to dump memory in the range 0x20000000..0x20001000 you can type:
dump 0x20000000 0x1000 out.dump
You can also list multiple memory regions that will be saved in the same file. The following will
store the memory region 0x00000..0x10000 and 0x20000000..0x20004000
dump 0 65536 0x20000000 16384 out.dump
What should I include in the coredump?
Please include both the whole RAM region of your device, as well as the used flash space.
How can I send you my coredump?
If your coredump and .elf do not contain sensitive information, you can just post them to GitHub,
as part of a new Bug Report.
If you would like to keep your files private, ask around on our Matrix chat first!