cargo-embed is the big brother of cargo-flash.
It can also flash a target just like cargo-flash, but it can also open an RTT terminal as well as a GDB server.
And there is much more to come in the future!
Installation
cargo-embed is installed as part of the probe-rs group of tools, see the Installation page.
Usage
You can use it like any cargo command would be used
cargo embed [OPTIONS] [CONFIG_PROFILE]This will do following in sequence:
- build your binary
- detect a probe
- (if enabled) upload the contents onto the connected target
- (if enabled) reset the target
- (if enabled) start RTT host side
- (if enabled) start gdb debugging
Configuration
You can configure cargo-embed with a file called Embed.toml (or
.embed.toml) in your project directory.
Config file precedence:
Embed.local.*.embed.local.*Embed.*.embed.*- Default configuration
Instead of a TOML file, you can also use a JSON or YAML file. Choose what suits you best!
Here’s a simple example:
[default.general]chip = "STM32F401CCUx"
[default.rtt]enabled = true
All available options can be found in the
default.toml.
This example uses toml syntax to set each option under the default top-level
profile key.
The Embed.toml should be part of the project, i.e. added to Git history. For
local-only configuration overrides, you can create an Embed.local.toml (or
.embed.local.toml) file and add that to your .gitignore. The local files take
precedence.
Profiles
The data in the Embed.toml is structured in two levels: The outer layer is a
configuration profile name, inside each profile there are then a series of
sections with different options. The default profile is called “default” ;)
When invoking cargo-embed, a different profile name can be passed as positional
argument CONFIG_PROFILE, which will load the settings under that profile
instead of default (see Usage).
For example, in your Embed.toml:
[default.general]chip = "STM32F401CCUx"
# No need to set this again, other profiles inherit from the "default" profile#[with_rtt.general]#chip = "STM32F401CCUx"
[with_rtt.rtt]enabled = true
Now you can run cargo embed with_rtt to have RTT enabled, while cargo embed
will use the default config “default” without RTT.
RTT
RTT stands for real time transfers and is a mechanism to transfer data between the debug host and the debuggee.
In its essence it provides a configurable amount of ringbuffers, which are read/written by the target and the debug host. The protocol initially was published by Segger but there is really no magic to it other than ringbuffers being used. This mechanism allows us to transfer data from the target to the host and vice versa really fast.
RTT features:
- Fast duplex data transfers
- A configurable amount of channels(buffers)
- Channels can be blocking and non blocking - your choice
This guide should get you going in no time to speed up your development with probe-rs.
Target
For the target side, we offer rtt-target, a small lib to set up the RTT structures in the target memory and read/write data from/to them.
A minimal example of a host firmware would be
#![no_std]#![no_main]
use microbit as _;use panic_halt as _;use rtt_target::{rprintln, rtt_init_print};
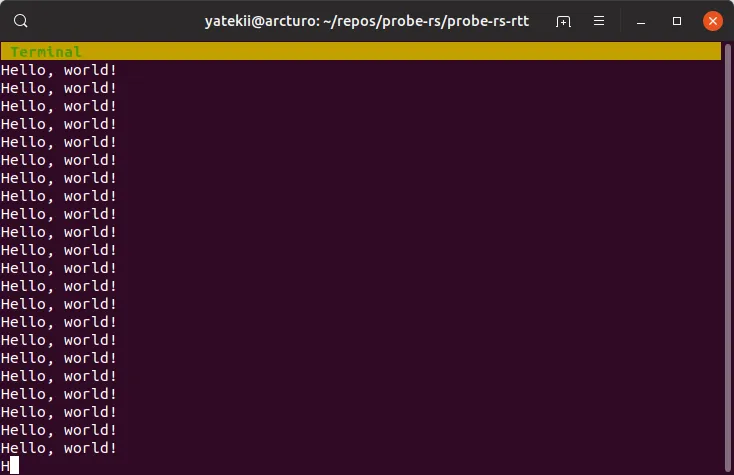
#[cortex_m_rt::entry]fn main() -> ! { rtt_init_print!(); loop { rprintln!("Hello, world!"); }}Host
On the host, just run
cargo embed
with RTT enabled in the Embed.toml file.
Now you should be able to see all the ‘Hello World!‘s in a default channel called “Terminal”!
Keyboard shortcuts
| Command | Action |
|---|---|
^c | Quit |
Fn{n} | Switch to tab n |
^{n} | Switch to tab n |
Tab | Switch to the next tab |
Shift+Tab | Switch to the previous tab |
| Any character | Add the character to the pending input |
Backspace | Delete the last character of the pending input |
Enter | Send the pending input |
PgUp | Scroll up half a screen |
UpArrow | Scroll up |
PgDn | Scroll down half a screen |
DownArrow | Scroll down |
^l | Clear current tab |
Don’t panic!
Of course it is easy to log all panics via RTT! Here is a most simple example of a panic handler:
#![no_std]#![no_main]
use core::panic::PanicInfo;use microbit as _;use rtt_target::{rprintln, rtt_init_print};
#[cortex_m_rt::entry]fn main() -> ! {    rtt_init_print!();    loop {        rprintln!("Hello, world!");
        for _ in 0..1_000_000 {            cortex_m::asm::nop();        }
        panic!("This is an intentional panic.");    }}
#[inline(never)]#[panic_handler]fn panic(info: &PanicInfo) -> ! {    rprintln!("{}", info);    loop {} // You might need a compiler fence in here.}
And in the open rttui view you should see the panic.
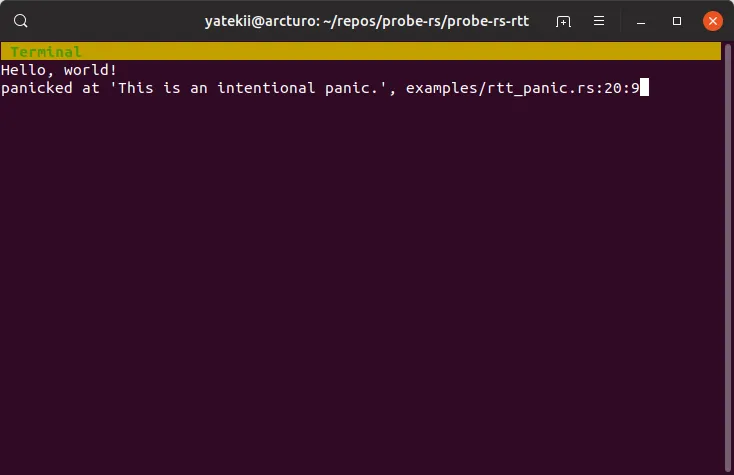
We intentionally ship no default panic handler, so that you may choose the channel of your choice to log the panic to.
So how do I get more channels, you might ask. Read on!
All the channels!
You can define multiple channels via a provided macro as seen in this snippet
#![no_main]#![no_std]
use microbit as _;use panic_halt as _;
use core::fmt::Write;use cortex_m_rt::entry;
use rtt_target::rtt_init;
#[entry]fn main() -> ! {    let channels = rtt_init! {        up: {            0: {                size: 512,                mode: BlockIfFull,                name: "Up zero",            }            1: {                size: 128,                name: "Up one",            }            2: {                size: 128,                name: "Up two",            }        }        down: {            0: {                size: 512,                mode: BlockIfFull,                name: "Down zero",            }        }    };
    let mut output2 = channels.up.1;    writeln!(        output2,        "Hi! I will turn anything you type on channel 0 into upper case."    )    .ok();
    let mut output = channels.up.0;    let mut log = channels.up.2;    let mut input = channels.down.0;    let mut buf = [0u8; 512];    let mut count: u8 = 0;
    loop {        let bytes = input.read(&mut buf[..]);        if bytes > 0 {            for c in buf.iter_mut() {                c.make_ascii_uppercase();            }
            let mut p = 0;            while p < bytes {                p += output.write(&buf[p..bytes]);            }        }
        writeln!(log, "Messsge no. {}/{}", count, bytes).ok();
        count += 1;
        for _ in 0..1_000_000 {            cortex_m::asm::nop();        }    }}
In this example we define three up channels and one down channel. The third up channel continuously logs, the second prints just a single info message and what the first one does, you’ll figure it when you examine channel two ;)
On the host side it looks like
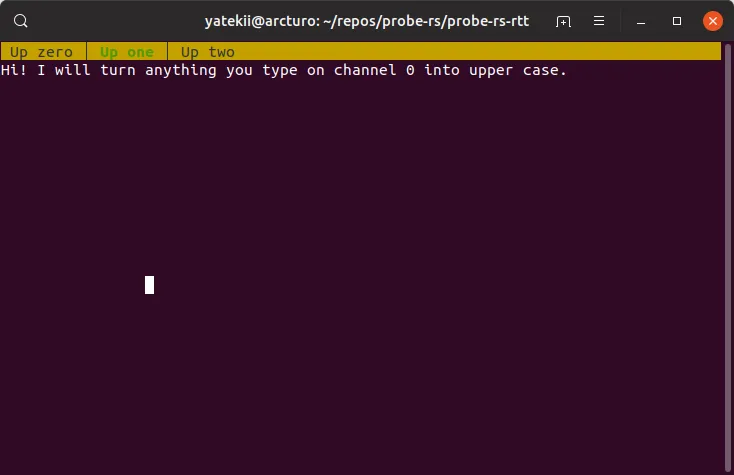
As you can observe, we see all three up channels. You can switch to and from them with the F-keys. The down channel will automatically be associated with the corresponding up channel and an input field will automatically be displayed for channels with a corresponding down channel. This is done via the channel number, which must be the same for the up and down channels. This is the default rttui behavior and can be configured. RTT itself can handle any up/down numbers combination.
External front-end via tcp socket
You can configure a TCP socket per channel to easily get the data available outside of Cargo Embed.
This is done via the rtt.channels configuration.
For example we can configure regular logs via Defmt on channel 0 while we stream sensordata from channel 1 via TCP to a real time plotting app. And maybe we can send the battery voltage on channel 2 as well (to a different socket). Of course you need to match these channels in your firmware as shown in the previous section.
[default.rtt]# Whether or not an RTTUI should be opened after flashing.enabled = trueup_channels = [ { channel = 0, mode = "BlockIfFull", format = "Defmt" }, { channel = 1, mode = "BlockIfFull", format = "String", socket = "127.0.0.1:12345" }, { channel = 2, mode = "BlockIfFull", format = "String", socket = "127.0.0.1:12346" },]# The UI configuration:tabs = [ { up_channel = 0, name = "Log" }, { up_channel = 1, name = "sensor-data", hide = true }, { up_channel = 2, name = "battery-level", hide = true },]This screenshot shows how it can be used with a single socket. The logger is configured to redirect log::trace!() to channel 1, which is then sent to the real time plotting app.
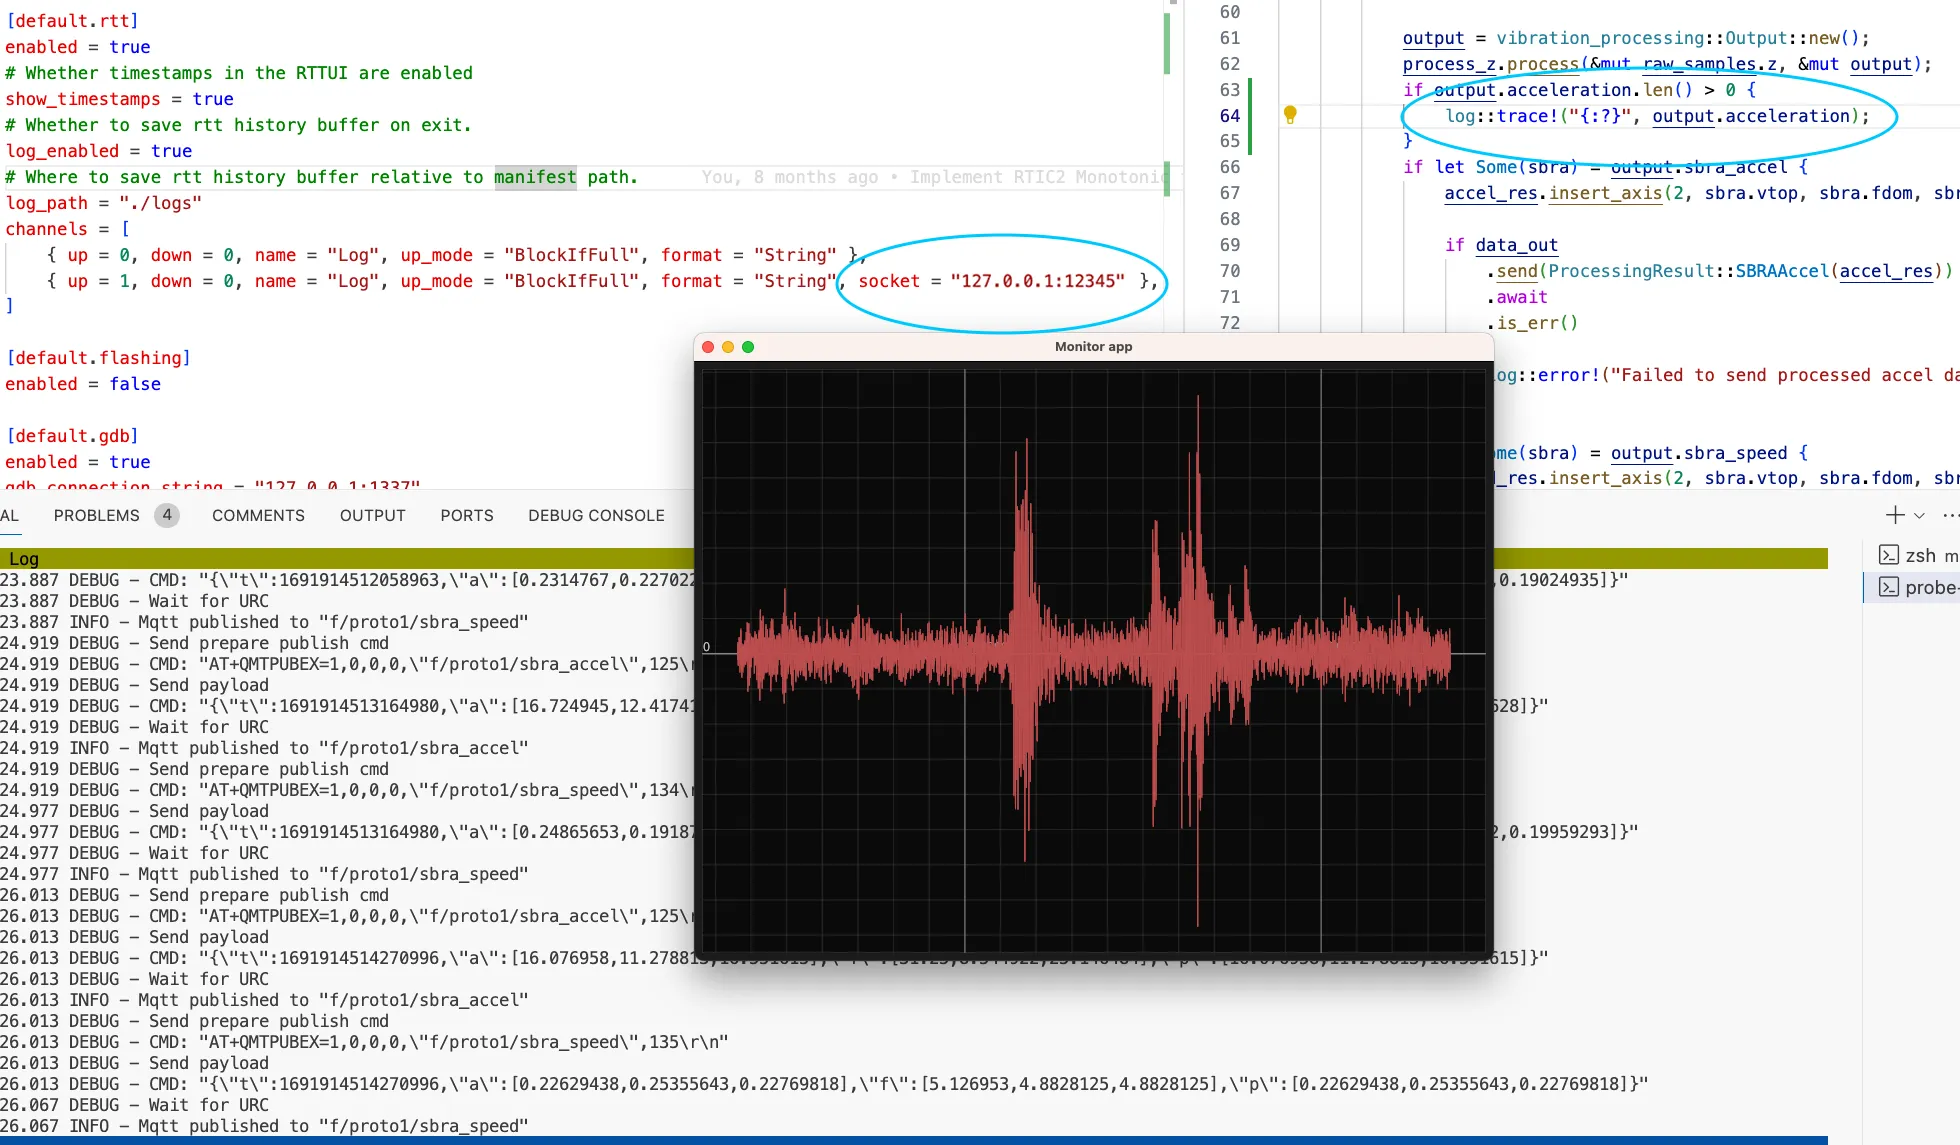
Note that the raw bytes are send over the socket, so no timestamps are added, nor any parsing or line splitting is done. You have all the flexibility to do this yourself in the tcp endpoint.
Now you should be able to debug conveniently. Happy coding!