The probe-rs VS Code extension uses the Microsoft Debug Adapter Protocol to implement an interactive debugging experience between VS Code and a probe-rs target.
The extension is currently in pre-production/Alpha stage, with limited functionality. For details of current status and functionality please read this section.
Installation
Install the probe-rs extension in VS Code, by installing the latest available from the Visual Studio Extension Marketplace. The extension will ask to install the probe-rs tools for you if it can’t find them on your system.
Usage and Configuration
To use the probe-rs extension for VS Code, you will need to configure a
launch.json entry for your target project.
We recommend that you familiarize yourself with the VSCode debug process, and specifically the section that discusses the differences between launch and attach request types.
The configuration choices may differ based on your use case, as demonstrated in the following examples:
- Start a debug session, by launching a new process on your target device.
- Start a debug session, by attaching to an existing process on your target device.
- Start a debug session (either form above) against a remote debug server process running on a server on a specific TCP/IP address and port.
- Using RTT to transfer data (e.g. logs, and println) between VSCode and your target application
Many of the entries in launch.json are optional, and the values for each are
described in the hover tips - alternatively, you can find the full list of
available options in the
Appendix. When values are
restricted, the allowable values are available through VS Code intellisense.
A minimum configuration would look something like this (required customizations are indicated with //!MODIFY tags )
Start a debug session with minimum configuration
{ "version": "0.2.0", "configurations": [ { "preLaunchTask": "${defaultBuildTask}", "type": "probe-rs-debug", "request": "launch", "name": "probe_rs Executable Test", "flashingConfig": { "flashingEnabled": true, }, //!MODIFY "chip": "STM32H745ZITx", "coreConfigs": [ { //!MODIFY "programBinary": "Relative or fully qualified path to your programBinary" } ] } ]}The following fully configured examples can be used (with customizations to reflect your own project and chip) to help you get started.
Using the launch request type
{ "version": "0.2.0", "configurations": [ { "type": "probe-rs-debug", "request": "launch", "name": "probe_rs Executable launch example", "cwd": "${workspaceFolder}", //!MODIFY (or remove) "speed": 24000, //!MODIFY (or remove) "probe": "VID:PID:<Serial>", "runtimeExecutable": "probe-rs", "runtimeArgs": ["dap-server"], //!MODIFY "chip": "STM32H745ZITx", "flashingConfig": { "flashingEnabled": true, "haltAfterReset": false, "formatOptions": { //!MODIFY (or remove). Valid values are: 'bin', 'hex', 'elf'(default), 'idf' "binaryFormat": "elf" } }, "coreConfigs": [ { "coreIndex": 0, //!MODIFY "programBinary": "Relative or fully qualified path to your programBinary", //!MODIFY "svdFile": "Relative or fully qualified path to the CMSIS-SVD file for your target core" } ], "env": { //!MODIFY (or remove) // If you set this variable, check the VSCode console log window for the location of the log file. "RUST_LOG": "info" }, // Info, Debug "consoleLogLevel": "Console" } ]}Using the attach request type
{ "version": "0.2.0", "configurations": [ { "type": "probe-rs-debug", "request": "attach", "name": "probe_rs Executable launch example", "cwd": "${workspaceFolder}", //!MODIFY (or remove) "speed": 24000, //!MODIFY "chip": "STM32H745ZITx", //!MODIFY (or remove) "probe": "VID:PID:<Serial>", "coreConfigs": [ { "coreIndex": 0, //!MODIFY "programBinary": "Relative or fully qualified path to your programBinary", //!MODIFY "svdFile": "Relative or fully qualified path to the CMSIS-SVD file for your target core" } ], "env": { //!MODIFY (or remove) // If you set this variable, check the VSCode console log window for the location of the log file. "RUST_LOG": "info" }, // Info, Debug "consoleLogLevel": "Console" } ]}Connecting to a standalone probe-rs dap-server server
To start probe-rs as a standalone server:
probe-rs dap-server --port 50000 # Replace the value 50000 with any available TCP port numberThen use the following launch.json to connect to it:
{ "version": "0.2.0", "configurations": [ { // Configure a default build task for 'cargo build' "preLaunchTask": "${defaultBuildTask}", "type": "probe-rs-debug", "request": "launch", "name": "probe_rs Server attach example", //!MODIFY ... can be a server that is remote from the VSCode session, but local to the probe "server": "127.0.0.1:50001", "cwd": "${workspaceFolder}", //!MODIFY (or remove) "speed": 24000, //!MODIFY "chip": "STM32H745ZITx", //!MODIFY (or remove) "probe": "VID:PID:<Serial>", "coreConfigs": [ { "coreIndex": 0, //!MODIFY "programBinary": "Relative or fully qualified path to your programBinary", //!MODIFY "svdFile": "Relative or fully qualified path to the CMSIS-SVD file for your target core" } ], //!This won't take effect. Please set environment variables before launching `probe-rs dap-server`. "env": {}, // Info, Debug "consoleLogLevel": "Console" } ]}Configuring RTT to transfer data
probe-rs and the VS Code extension supports using RTT in your target
application.
For more information on how to configure your target application to use RTT, please refer to the instructions under the cargo-embed section of this guide.
In order to capture the RTT output in the VSCode extension, you will need to
supply additional entries to your applications launch.json entry. You can use
the following example and modify the channel information to match the
rtt-target channel configurations in your application.
{ "version": "0.2.0", "configurations": [ { "type": "probe-rs-debug", "request": "launch", "name": "probe_rs rtt-target example", // ... <snip> ... "coreConfigs": [ { "coreIndex": 0, // ... <snip> ... "rttEnabled": true, "rttChannelFormats": [ { "channelNumber": 0, // Format RTT data as String data "dataFormat": "String", // Include host-side timestamps for every line of data transferred from the target RTT output "showTimestamps": true }, { "channelNumber": 1, // Treat data as raw binary data, and do not format in any way "dataFormat": "BinaryLE" } ] } ] } ]}In addition to supporting RTT channels with rtt-target, we also support using the defmt (a highly efficient logging framework that targets resource-constrained devices, and supports complex formatting and RUST_LOG-like logging.)
When using defmt, we can configure the client side based on what is captured
in your application, and the launch.json only requires minimal additional
configuration.
{ "version": "0.2.0", "configurations": [ { "type": "probe-rs-debug", "request": "launch", "name": "probe_rs rtt-target example", // ... <snip> ... "coreConfigs": [ { "coreIndex": 0, "rttEnabled": true } ] } ]}NOTE: Using RTT along with low power modes has some limitations. Frameworks such as embassy and rtic uses low power by default and this can cause RTT to not produce any output on some devices. In some cases, this can be overcome by configuring your device to enable the RCC DMA clock before entering low power.
NOTE: When using defmt RTT, please keep the following limitations in mind.
- Due to the way the
defmtcrate works, it is currently not possible to mixdefmtandrtt-targetchannels in a single application. - The
defmtcrate always uses channel number 0 for its output. - The
defmtcrate introduced a new log filter that filters out log statements at build time. To ensure your defmt logging is not default filtered toerrorlevel, you can either add the environment variable in your.cargo/configfile, or add theoptionssetting of yourtasks.json(see below), to match your desired logging level on the target.
Adding DEFMT_LOG to .cargo/config.toml
[env]DEFMT_LOG = "info"Adding DEFMT_LOG to tasks.json
// ... <snip> ... "options": { "env": { //!MODIFY: Remove or use any of the supported DEFMT_LOG options. "DEFMT_LOG": "info" } }, "tasks": [// ... <snip> ...TIP: When using RTT, the data is streamed into a terminal window on a per channel basis. If your application uses multiple RTT channels, you may want to consider using the new VSCode Terminal tabs setting.
Current working functionality and known limitations
- Launch: Start a debug session on the target by (optionally) flashing the target firmware.
- Attach: By default, VSCode will manage (start/stop) the
probe-rs dap-serverprocess to facilite a debug session against a target process. It is also possible for the user to manage theprobe-rs dap-serveras a standalone process, and then use TCIP/IP port to connect to from VSCode. - Connect to the target with
probe-rs- Supports
connect-under-resetfor select targets. - Tested against the following architectures:
- Cortex-M7 using STM32H745
- Cortex-M4 using nRF52833_xxAA
- Cortex-M0 using Raspberry PICO
- RISC-V using ESP32-C3
- Supports
- Flash the chip with your own binary.
- Supports
full-chip-erase, andrestore-unwritten-bytes - Supports
halt-after-reset. This will allow you to set breakpoints in your main() function. - Supports flashing the following binary types:
bin- “The target binary file contains the contents of the flash 1:1”.hex- “The target binary file conforms with the Intel HEX format.”elf- “The target binary file conforms with the ELF format.”idf- “The target binary file conforms with the ESP-IDF bootloader format.”
- Supports
- Set, clear, disable, enable hardware Breakpoints.
- In VSCode
Source view, breakpoint locations will automatically be adjusted to code boundaries that lie safely between function prologues and epilogues. - In VSCode
Disassembly view, breakpoints are set at, and stepping works at, ‘instruction level’
- In VSCode
- UPDATED: Stepping through executing code during debug:
- Supports stepping at ‘statement’ level with
Step Over,Step Into,Step Out. Stepping desitnations will automatically be adjusted to code boundaries that lie safely between function prologues and epilogues. - While VSCode ‘Disassembly view` is open, all stepping automatically happens at ‘instruction’ granularity, and will allow the user to step to any target location, including instructions in a function prologue or epilogue.
- Supports stepping at ‘statement’ level with
- Variables View
- View values of core Registers, and changes during code execution
- View values of Locals and Statics variables, and update values
during code execution.
- Shows datatypes and values for the following Rust datatypes.
- Base types, including &str
- Enumerations
- Structures
- Pointers
- Variants
- Arrays
- Unions
- Options & Results
- Unit types
- Formal parameters to functions.
- TODO: Add support for additional types, such as Generics, etc.
- Use the
Set Variablecommand in VSCode to update variable values. - Use the
View Binary Datacommand in VSCode to perform binary memory edits on the target device.
- Shows datatypes and values for the following Rust datatypes.
- Call Stack View
- Supports a single thread, for a single core of the chip, but will allow selection of any frames that are in the current thread
- Supports the VSCode
Dissamblyview, andSetInstructionBreakpoints - TODO: Support multiple threads
- TODO: Support chips with multiple cores
- Watch View Monitor values of selected variables.
- RTT - Configure RTT Channels and capture their output in the
VSCode Integrated Terminal- RTT Channels that support logging data to VSCode Terminal windows
- Use the REPL command line in the Debug Console evaluate variables
- Navigate and monitor SVD Peripheral registers
Building and Testing the debug extension in VS Code
Please refer to the repository README.md file for the latest instructions on how to build and deploy the extension.
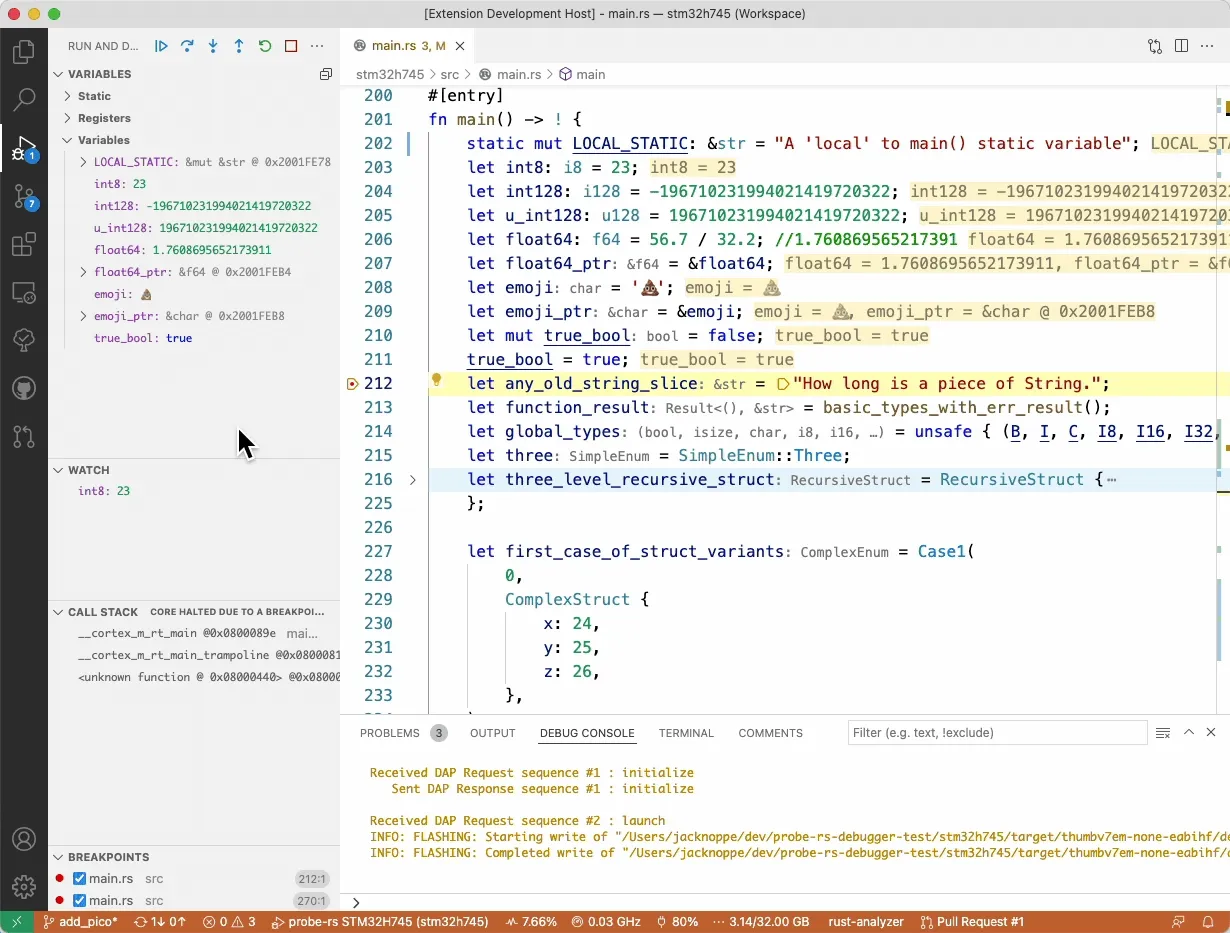
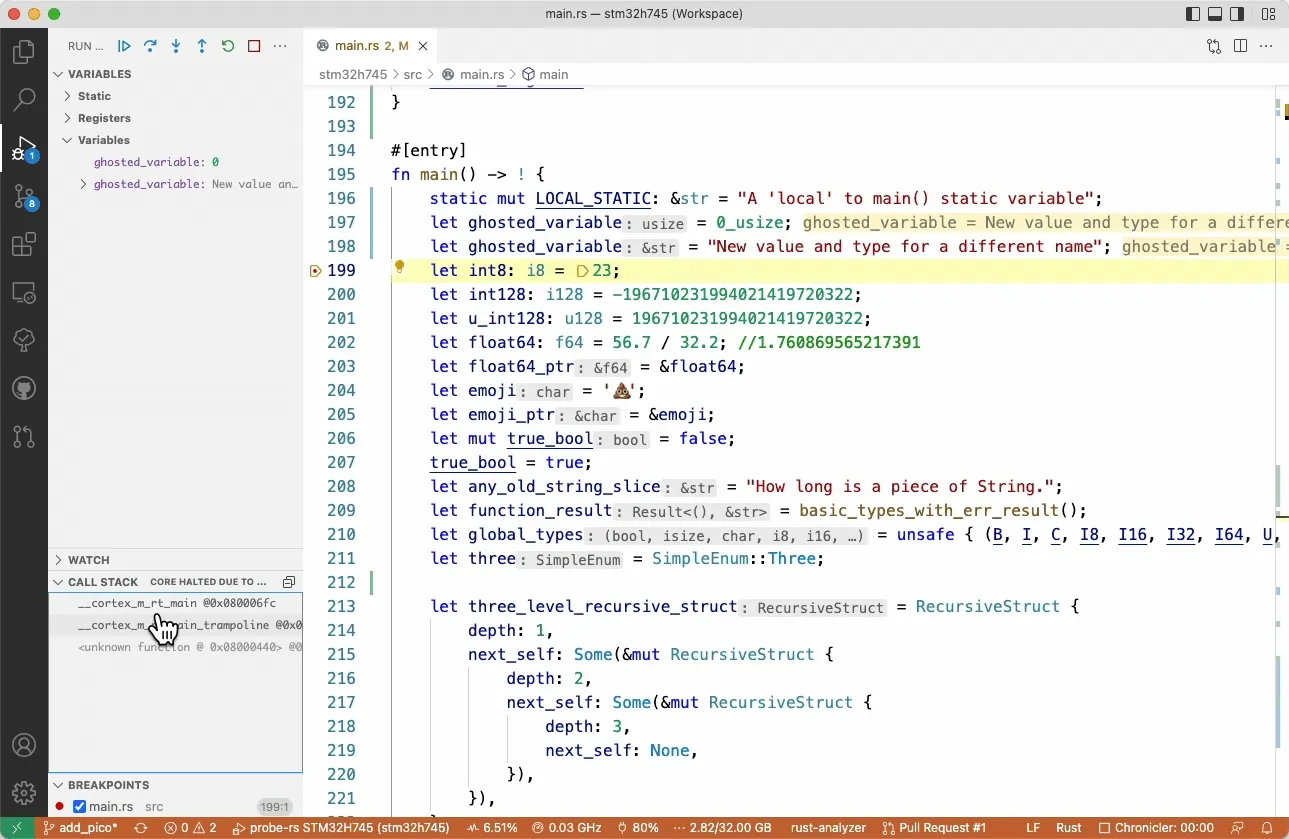
A visual guide of implemented features
The Basics, and viewing RTT data
Use the Set Variable command to update variable values during debugging
Use the View Binary Data to view and perform binary edits of target memory
Use the Disassembly to see the assembly code executed on the target, and set instruction breakpoints in this view
Use CMSIS-SVD definitions to navigate and monitor device peripheral registers
Appendix: All supported configuration options.
This options available in launch.json are based on the configuration options
of the
probe-rs library,
with names that are converted to camelCase, in order to be compatible with
VSCode requirements. There are slight variations in supported options for
launch or attach configurations, and these can be seen below. Please refer
to the section “Launching and Attaching” in
the official MS DAP documentation
for more details.
Launch: Supported configuration options.
"launch": { "required": [ "chip", "coreConfigs" ], "properties": { "server": { "type": "string", "description": "Optionally connect to an existing `probe-rs dap-server` session on IP and Port, e.g. '127.0.0.1:50000'", "default": "127.0.0.1:50000" }, "logFile": { "type": "string", "description": "The path to the log file. This option is ignored if either the `server` or `runtimeArgs` is specified. If no location is specified, the behaviour depends on `--log-to-folder" }, "logToFolder": { "type": "boolean", "description": "Enable logging to the default folder. This option is ignored if either the `logFile` or `runtimeArgs` is specified.`" }, "consoleLogLevel": { "type": "string", "description": "The level of log info printed to the console. This does NOT affect the RUST_LOG defined in the `env` property.", "enum": [ "Console", "Info", "Debug" ], "enumDescriptions": [ "The console will only contain error messages and process status messages.", "The console log will also contain high level information about interactions between the extension and the debug adapter.", "The console log will also contain detailed information about interactions between the extension and the debug adapter." ], "default": "Console" }, "runtimeExecutable": { "type": "string", "description": "An OS resolvable path to the Probe-rs debugger executable.", "default": "probe-rs" }, "runtimeArgs": { "type": "array", "items": { "type": "string" }, "description": "String array of arguments to provide the startup arguments for the Probe-rs debugger executable.", "default": [ "dap-server" ] }, "env": { "additionalProperties": { "type": "string" }, "default": {}, "description": "Environment variables defined as a key value pair. The 'key' is the name of the environment variable, and the 'value' is value of the environment variable.", "type": "object" }, "cwd": { "type": "string", "description": "The working directory of the debugger, typically the RUST crate root", "default": "${workspaceFolder}" }, "probe": { "type": "string", "description": "Use this flag to select a specific probe in the list. Use '--probe VID:PID' or '--probe VID:PID:Serial' if you have more than one probe with the same VID:PID." }, "chip": { "type": "string", "description": "Please specify the appropriate chip from the list of supported chips reported by running `probe-rs chip list`." }, "chipDescriptionPath": { "type": "string", "description": "Use this option to add custom target chips from a file." }, "connectUnderReset": { "type": "boolean", "description": "This option will result in the target reset pin being held high during the attach operation.", "default": false }, "speed": { "type": "number", "description": "Specify the protocol speed in kHz." }, "wireProtocol": { "type": "string", "description": "The correct wire protocol to use.", "enum": [ "Swd", "Jtag" ], "enumDescriptions": [ "Use the Serial Wire Debug (SWD) protocol.", "Use the Joint Test Action Group (JTAG) protocol." ] }, "allowEraseAll": { "type": "boolean", "description": "Allow the session to erase all memory of the chip or reset it to factory default.", "default": false }, "flashingConfig": { "type": "object", "additionalProperties": false, "description": "These options are applied when flashing one or more `program_binary` files to the target memory.", "properties": { "flashingEnabled": { "type": "boolean", "description": "Flash the target before debugging.", "default": false }, "haltAfterReset": { "type": "boolean", "description": "Halt all cores on the target after reset.", "default": false }, "fullChipErase": { "type": "boolean", "description": "Do a full chip erase, versus page-by-page erase.", "default": false }, "restoreUnwrittenBytes": { "type": "boolean", "description": "Restore erased bytes that will not be rewritten from ELF.", "default": false }, "formatOptions": { "type": "object", "additionalProperties": false, "properties": { "binaryFormat": { "type": "string", "description": "One of the supported binary formats probe-rs uses for flashing the target binary.", "enum": [ "bin", "hex", "elf", "idf" ], "enumDescriptions": [ "The target binary file contains the verbatim contents of the flash.", "The target binary file conforms with the [Intel HEX](https://en.wikipedia.org/wiki/Intel_HEX) format.", "The target binary file conforms with the [ELF](https://en.wikipedia.org/wiki/Executable_and_Linkable_Format) format.", "The target binary file conforms with the [ESP-IDF bootloader](https://docs.espressif.com/projects/esp-idf/en/latest/esp32/api-reference/system/app_image_format.html#app-image-structures) format" ], "default": "elf" }, "baseAddress": { "type": "number", "description": "The address in memory where the binary will be flashed to." }, "skip": { "type": "number", "description": "The number of bytes to skip at the start of the binary file." }, "idf_bootloader": { "type": "string", "description": "The path (relative to `cwd` or absolute) to the ESP-IDF bootloader." }, "idf_partition_table": { "type": "string", "description": "The path (relative to `cwd` or absolute) to the ESP-IDF partition table." } } } } }, "coreConfigs": { "type": "array", "description": "Each MCU core has a mandatory `programBinary` as well as several other optional properties.", "items": { "type": "object", "additionalProperties": false, "required": [ "programBinary" ], "properties": { "coreIndex": { "type": "number", "description": "The zero based index of the MCU core for this session", "default": 0 }, "programBinary": { "type": "string", "description": "The path (relative to `cwd` or absolute) to the binary for your target firmware" }, "svdFile": { "type": "string", "description": "The path (relative to `cwd` or absolute) to the CMSIS-SVD file for your target core" }, "rttEnabled": { "type": "boolean", "description": "If true, the debugger will open an RTT Terminal tab for each of the active channels on the target.", "default": false }, "rttChannelFormats": { "type": "array", "description": "RTT channel configuration. Unlisted active channels will be configured with `dataFormat=String', and 'showTimestamps=true'.", "items": { "type": "object", "required": [ "channelNumber" ], "properties": { "channelNumber": { "type": "number", "description": "The channel number to which this data format applies." }, "dataFormat": { "type": "string", "description": "One of the supported data formats for RTT channels.", "enum": [ "String", "BinaryLE", "Defmt" ], "enumDescriptions": [ "String (text) format.", "Binary Little Endian format.", "defmt (see: https://defmt.ferrous-systems.com)." ], "default": "String" }, "mode": { "type": "string", "description": "RTT operating mode.", "enum": [ "NoBlockSkip", "NoBlockTrim", "BlockIfFull" ], "enumDescriptions": [ "The target will add data to the channel only if it fits completely, otherwise it will skip the data.", "The target will add as much data to the channel as possible, without blocking.", "The target will block until there is enough space in the channel to add the data." ] }, "showTimestamps": { "type": "boolean", "description": "Enable the inclusion of timestamps in the RTT output for `dataFormat=String`." }, "showLocation": { "type": "boolean", "description": "Enable the inclusion of defmt location information in the RTT output for `dataFormat=Defmt`." }, "logFormat": { "type": "string", "description": "The default format string to use for decoding defmt logs." } } } } } } } }}Attach: Supported configuration options.
"attach": { "required": [ "chip", "coreConfigs" ], "properties": { "server": { "type": "string", "description": "Optionally connect to an existing `probe-rs dap-server` session on IP and Port, e.g. '127.0.0.1:50000'", "default": "127.0.0.1:50000" }, "logFile": { "type": "string", "description": "The path to the log file. This option is ignored if either the `server` or `runtimeArgs` is specified. If no location is specified, the behaviour depends on `--log-to-folder" }, "logToFolder": { "type": "boolean", "description": "Enable logging to the default folder. This option is ignored if either the `logFile` or `runtimeArgs` is specified.`" }, "consoleLogLevel": { "type": "string", "description": "The level of log info printed to the console. This does NOT affect the RUST_LOG defined in the `env` property.", "enum": [ "Console", "Info", "Debug" ], "enumDescriptions": [ "The console will only contain error messages and process status messages.", "The console log will also contain high level information about interactions between the extension and the debug adapter.", "The console log will also contain detailed information about interactions between the extension and the debug adapter." ], "default": "Console" }, "runtimeExecutable": { "type": "string", "description": "An OS resolvable path to the Probe-rs debugger executable.", "default": "probe-rs" }, "runtimeArgs": { "type": "array", "items": { "type": "string" }, "description": "String array of arguments to provide the startup arguments for the Probe-rs debugger executable.", "default": [ "dap-server" ] }, "env": { "additionalProperties": { "type": "string" }, "default": {}, "description": "Environment variables defined as a key value pair. The 'key' is the name of the environment variable, and the 'value' is value of the environment variable.", "type": "object" }, "cwd": { "type": "string", "description": "The working directory of the debugger, typically the RUST crate root", "default": "${workspaceFolder}" }, "probe": { "type": "string", "description": "Use this flag to select a specific probe in the list. Use '--probe VID:PID' or '--probe VID:PID:Serial' if you have more than one probe with the same VID:PID." }, "chip": { "type": "string", "description": "Please specify the appropriate chip from the list of supported chips reported by running `probe-rs chip list`." }, "chipDescriptionPath": { "type": "string", "description": "Use this option to add custom target chips from a file." }, "connectUnderReset": { "type": "boolean", "description": "This option will result in the target reset pin being held high during the attach operation.", "default": false }, "speed": { "type": "number", "description": "Specify the protocol speed in kHz." }, "wireProtocol": { "type": "string", "description": "The correct wire protocol to use.", "enum": [ "Swd", "Jtag" ], "enumDescriptions": [ "Use the Serial Wire Debug (SWD) protocol.", "Use the Joint Test Action Group (JTAG) protocol." ] }, "allowEraseAll": { "type": "boolean", "description": "Allow the session to erase all memory of the chip or reset it to factory default.", "default": false }, "coreConfigs": { "type": "array", "description": "Each MCU core has a mandatory `programBinary` as well as several other optional properties.", "items": { "type": "object", "additionalProperties": false, "properties": { "required": [ "programBinary" ], "coreIndex": { "type": "number", "description": "The zero based index of the MCU core for this session", "default": 0 }, "programBinary": { "type": "string", "description": "The path (relative to `cwd` or absolute) to the binary for your target firmware" }, "svdFile": { "type": "string", "description": "The path (relative to `cwd` or absolute) to the CMSIS-SVD file for your target core" }, "rttEnabled": { "type": "boolean", "description": "If true, the debugger will open an RTT Terminal tab for each of the active channels on the target.", "default": false }, "rttChannelFormats": { "type": "array", "description": "RTT channel configuration. Unlisted active channels will be configured with `dataFormat=String', and 'showTimestamps=true'.", "items": { "type": "object", "additionalProperties": false, "required": [ "channelNumber" ], "properties": { "channelNumber": { "type": "number", "description": "The channel number to which this data format applies." }, "dataFormat": { "type": "string", "description": "One of the supported data formats for RTT channels.", "enum": [ "String", "BinaryLE", "Defmt" ], "enumDescriptions": [ "String (text) format.", "Binary Little Endian format.", "defmt (see: https://defmt.ferrous-systems.com)." ], "default": "String" }, "mode": { "type": "string", "description": "RTT operating mode.", "enum": [ "NoBlockSkip", "NoBlockTrim", "BlockIfFull" ], "enumDescriptions": [ "The target will add data to the channel only if it fits completely, otherwise it will skip the data.", "The target will add as much data to the channel as possible, without blocking.", "The target will block until there is enough space in the channel to add the data." ] }, "showTimestamps": { "type": "boolean", "description": "Enable the inclusion of timestamps in the RTT output for `dataFormat=String`." }, "showLocation": { "type": "boolean", "description": "Enable the inclusion of defmt location information in the RTT output for `dataFormat=Defmt`." }, "logFormat": { "type": "string", "description": "The default format string to use for decoding defmt logs." } } } } } } } }}Other editors
VSCode not your cup of tea? No problem!
probe-rs implements the Debug Adapter Protocol, so you can use other editors, IDEs, and visual debuggers, such as Vimspector…
Emacs via Dape
Dape is a well-written Emacs package for DAP debuggers. Setup with Dape tends to be a little tricky at times, as Dape does not support launch.json configurations, so transposition into the configuration syntax is required. Additionally, in order to support RTT logging, some event handling methods are required. Once setup, however, it works well.
You can read more about Dape here. In addition to the documentation and regular help functions built into Emacs, such as describe-function, describe-variable and customize, you can also visit the Dape wiki page for more examples for many different DAP debuggers.
Assuming dape is already installed, you can setup dape for probe-rs as follows:
  ;; These methods setup and then intercept RTT data events from  ;; probe-rs, providing Log output directly in the REPL.  (cl-defmethod dape-handle-event (conn (_event (eql probe-rs-rtt-data)) body)    "When Probe.rs sends RTT messages, insert them into the REPL.CONN is the `dape-connection'.BODY is the contents of the event."    (let ((data (plist-get body :data)))      (dape--repl-insert (format "%s\n" data))))
  (cl-defmethod dape-handle-event (conn (_event (eql probe-rs-rtt-channel-config)) body)    "When Probe.rs sends channel config info, send a request to let it know the 'terminal window' is open.CONN is the `dape-connection'.BODY is the contents of the event."    (dape-request conn "rttWindowOpened"                  '((channelNumber . 0)(windowIsOpen . t))))
(setq target-binary "embassy-blinky"      target-architecture-triple "thumbv7em-none-eabihf"      target-chip "STM32WB55RG"      target-chip-svd-path      (expand-file-name "res/STM32WB55_CM4.svd"                        (project-root (project-current)))      target-binary-path      (expand-file-name       (format "target/%s/debug/%s"               target-architecture-triple               target-binary)       (project-root (project-current))))
(add-to-list 'dape-configs               '(probe-rs modes (rust-mode)                          command "probe-rs"                          command-args ("dap-server" "--port" :autoport)                          host "localhost"                          port :autoport                          compile "cargo build"                          :chip target-chip                          :coreConfigs [(                                         :programBinary target-binary-path                                         :coreIndex 0                                         :svdFile target-chip-svd-path                                         :rttEnabled t                                         :rttChannelFormats [(:channelNumber 0 :dataFormat "String" :showTimestamps t)])]                          :flashingConfig (:flashingEnabled t)                          :type "probe-rs-debug"                          :consoleLogLevel "Console"                          :type "probe-rs-debug"                          :request "launch"))
NVIM via nvim-dap
nvim-dap is a popular nvim plugin to work with dap debuggers. Setting up nvim-dap for probe-rs is in principle straight forward, and many things work with minimal config. RTT messages and other messages from probe-rs are implemented over DAP events like “probe-rs-show-messages”, “probe-rs-rtt-data”, and “probe-rs-rtt-channel-config”. The last one is requiring a response to enable the RTT data.
You can find a config snippet in the nvim-dap wiki which supports the handshake to get those messages, print them in the dap-repl, and additionally log them to a file in the cwd. You can change this to your liking. If you found better solutions, like printing to the dapui-console, please expand the wiki.
nvim-dap supports reading of .vscode/launch.json. Since the configuration will strongly vary from project to project the config snippet does not contain a configuration. You need to import the launch.json in your project. If you use a nvim distribution like astronvim automatic import of launch.json is preconfigured. Otherwise you need to configure it yourself or run :lua require('dap.ext.vscode').load_launchjs(). The linkage of the adapter to rust is already setup in the config snippet.
If you are using lazy.nvim as plugin manager, setup can be done by adding the following lua module:
/path/to/your/lua/plugins/nvim-dap-probe-rs.lua
return { "mfussenegger/nvim-dap", opts = function() local dap = require "dap" if not dap.adapters then dap.adapters = {} end dap.adapters["probe-rs-debug"] = { type = "server", port = "${port}", executable = { command = vim.fn.expand "$HOME/.cargo/bin/probe-rs", args = { "dap-server", "--port", "${port}" }, }, } -- Connect the probe-rs-debug with rust files. Configuration of the debugger is done via project_folder/.vscode/launch.json require("dap.ext.vscode").type_to_filetypes["probe-rs-debug"] = { "rust" } -- Set up of handlers for RTT and probe-rs messages. -- In addition to nvim-dap-ui I write messages to a probe-rs.log in project folder -- If RTT is enabled, probe-rs sends an event after init of a channel. This has to be confirmed or otherwise probe-rs wont sent the rtt data. dap.listeners.before["event_probe-rs-rtt-channel-config"]["plugins.nvim-dap-probe-rs"] = function(session, body) local utils = require "dap.utils" utils.notify( string.format('probe-rs: Opening RTT channel %d with name "%s"!', body.channelNumber, body.channelName) ) local file = io.open("probe-rs.log", "a") if file then file:write( string.format( '%s: Opening RTT channel %d with name "%s"!\n', os.date "%Y-%m-%d-T%H:%M:%S", body.channelNumber, body.channelName ) ) end if file then file:close() end session:request("rttWindowOpened", { body.channelNumber, true }) end -- After confirming RTT window is open, we will get rtt-data-events. -- I print them to the dap-repl, which is one way and not separated. -- If you have better ideas, let me know. dap.listeners.before["event_probe-rs-rtt-data"]["plugins.nvim-dap-probe-rs"] = function(_, body) local message = string.format("%s: RTT-Channel %d - Message: %s", os.date "%Y-%m-%d-T%H:%M:%S", body.channelNumber, body.data) local repl = require "dap.repl" repl.append(message) local file = io.open("probe-rs.log", "a") if file then file:write(message) end if file then file:close() end end -- Probe-rs can send messages, which are handled with this listener. dap.listeners.before["event_probe-rs-show-message"]["plugins.nvim-dap-probe-rs"] = function(_, body) local message = string.format("%s: probe-rs message: %s", os.date "%Y-%m-%d-T%H:%M:%S", body.message) local repl = require "dap.repl" repl.append(message) local file = io.open("probe-rs.log", "a") if file then file:write(message) end if file then file:close() end end end,}